A Basic Model
Model Structure
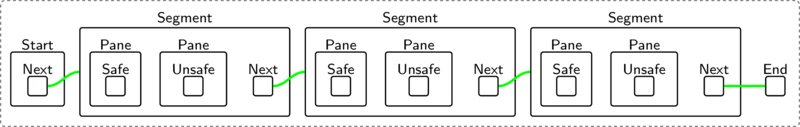
Lets start by defining the key entities of interest. We know we need a bridge
Segment, made up of Panes, and Panes are Safe or Unsafe. Because this
is a segment, it will need to connect to the previous/next part of the bridge.
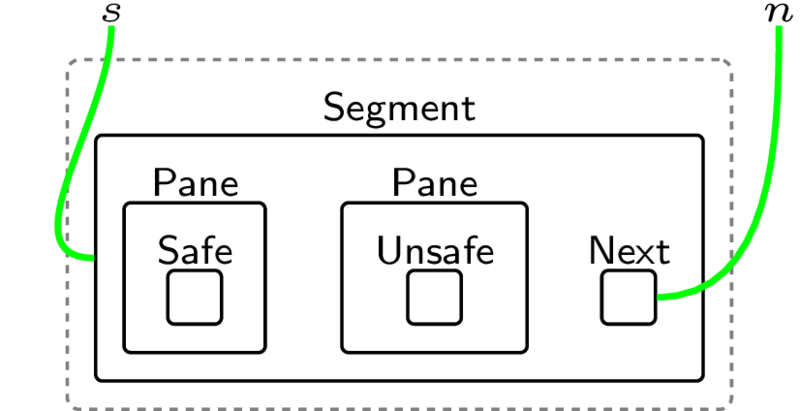
In bigraphs we model entity relations in two ways: through nesting such as the
Pane containing Safe or Unsafe and through linking. The names \(s\) and \(n\)
denote that this Segment and Next entity can (but do not need to) connect
somewhere else in a larger model. The dashed outline says similar, but for the
placement. That is, this bigraph might be itself nested within (or placed
alongside) a larger bigraph.
This is a classic model of a linked list node. Since players never go backwards,
we don't need to track previous links (it's a single ended linked list). In
bigraphs we don't have a notion of link direction built in, so we encode that using
the Next entity.
A bridge is then a set of these segments with some well defined Start and
End points (which is useful for determining when a player is safe).
For players, each Player has an Id(n) 1, and, like the bridge, is also
part of a chain that defines the order they cross in:
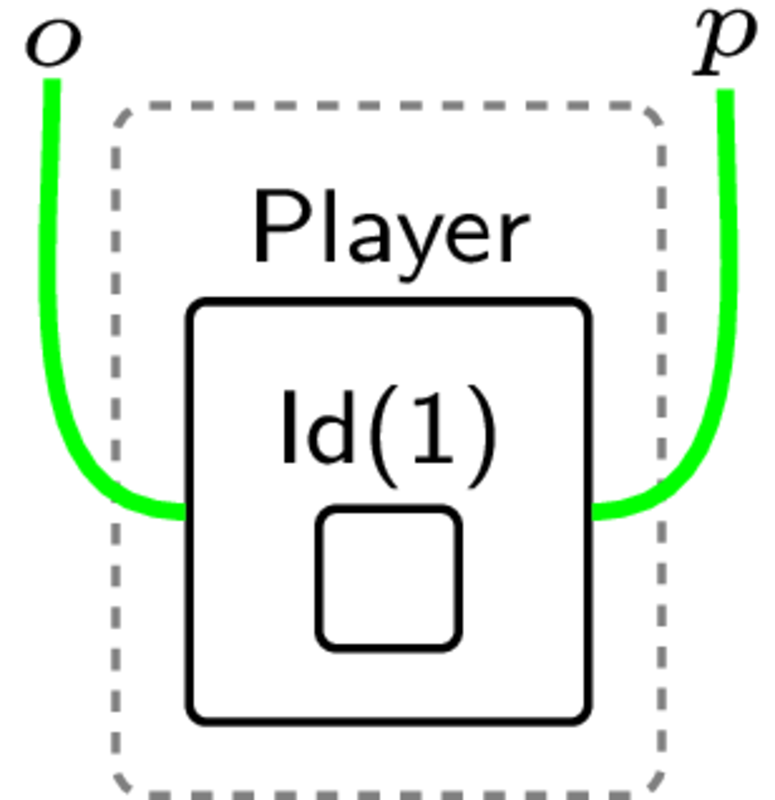
As before, there is no direction, on the links so in the model we maintain a
"pointer" to the Front of the player list. We could alternatively use the same
Next style model as before (but I wanted to show some other features).
Putting it together, an initial state might be something like:
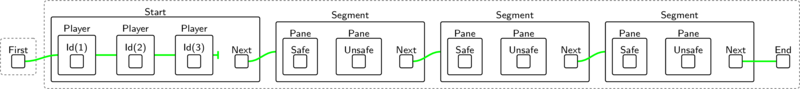
Here we use a much smaller version of the game, with 3 players and 3 bridge segments, to keep it easy to visualise. We will scale this up later. Not too far off what we might scribble on a whiteboard.
Modelling the Game Dynamics
Once we have the basic structure we can define how this should change over time. That is, how we will implement the rules of the game.
In bigraphs, we do this by defining rewrite rules. The idea is that we can replace a match of the left-side of a rule with the right-side of a rule. Lets see how this works by example: handling movement between a bridge segments.
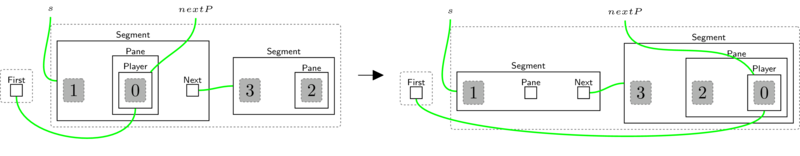
An interesting feature of the rule is the use of sites that we denote with the
dashed grey rectangle (which are similar to variables in programming languages).
These represent the fact at there "might be other things here". We use them here
to abstract away the Safe or Unsafe (the players can't tell after all), and
also to let us just look at one of the Panes (the other is "inside" the site).
We also use it to not care which Player we are looking at (the specific Id
is hidden). The numbers within the sites determine what sites map where on the
right. For example, the site that was in the player stays within the player (in
general this allows copying and deletion of sites, but we don't need that here).
The unfilled dashed rectangles are called regions and just mean that First
could be somewhere else in the system (except directly above or below the other
region), e.g. it might be nested in another entity.
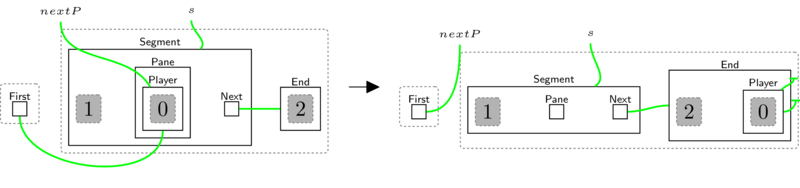
Since Start and End are not bridge segments, they are not captured
by the segment move rule. The rule to move from the Start to the first segment
is essentially the same as a move (but matching Start instead of Segment on
the left) so lets not bother showing it here. In the case we move to the end, we
additionally remove the player from the player queue and update the Front to
the next player. We will leave the Player themselves in the End zone to make
it easier to write properties of interest.
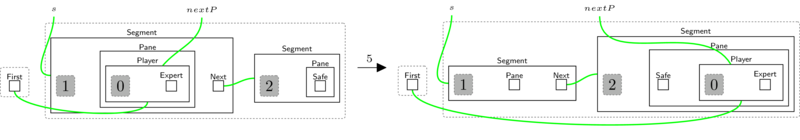
After handling movement, we need rules to handle the stepping on the panes. The first if we stood on the untempered glass (oops!):
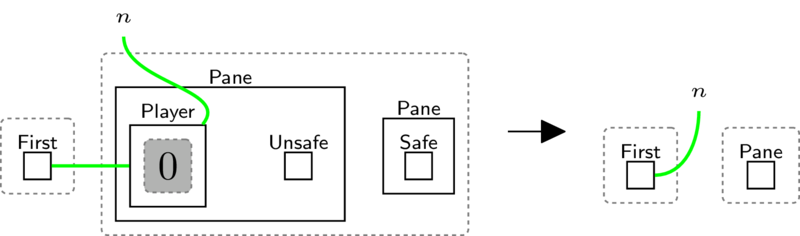
This rule removes the player and the pane from the game and sets the next player
to the front ready to move. Since it becomes obvious which pane is now safe, we
keep one Pane (empty implying it is always safe) to allow future players to
cross the bridge segment.
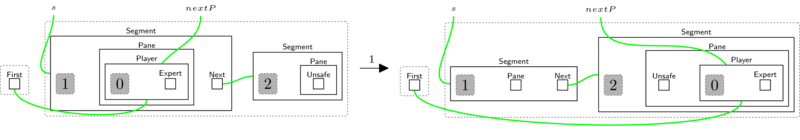
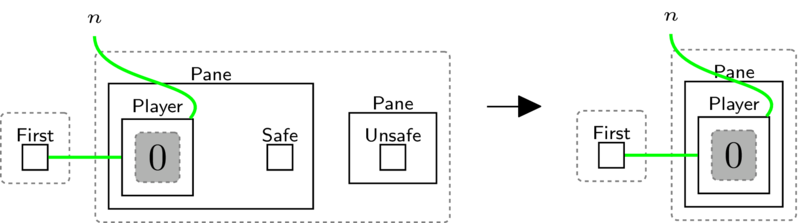
If the player luckily lands on the safe pane, we remove the Safe marker (as
before) and, since all players can see this was the right pane to choose, we
simply remove the unsafe pane (since no one would ever try to stand on it again
anyway!).
When applying the rules we always apply pane breaking rules first and then movement (BigraphER supports a priority ordering over rules).
Analysing the Model
Now we have the model good to go, we can analyse it with BigraphER and the PRISM probabilistic model checker. First we can ask BigraphER to explore all possible states. This generates a transition system like:
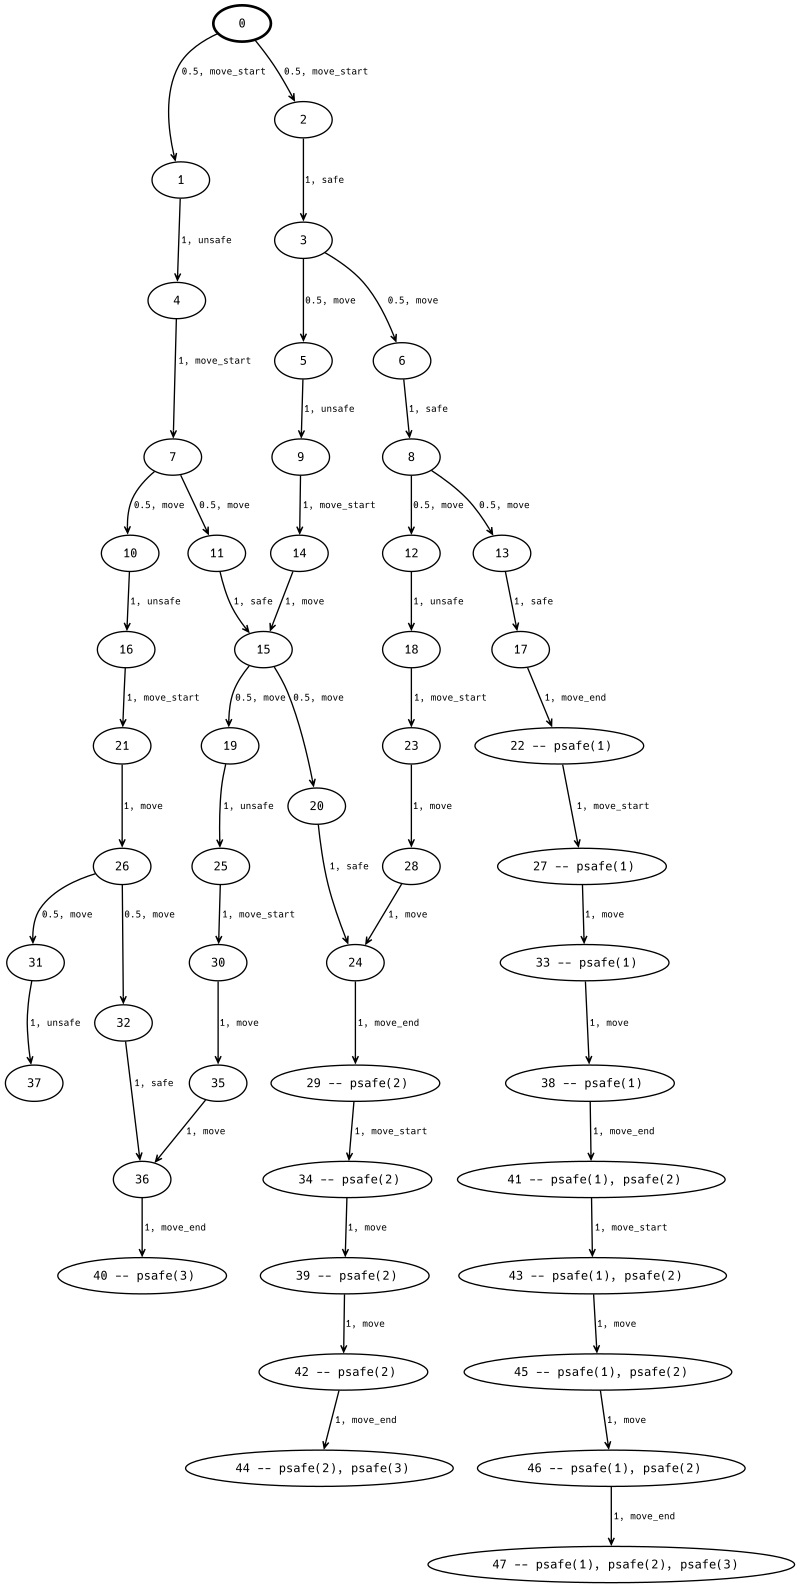
This shows, from our initial state, all possible paths, e.g. all the different ways our players might traverse the game. The link labels say which rule has been applied, and the numbers before are the probability.
Here we are actually using probabilistic bigraphs, where rules can have weight (representing the relative likelihood they are applied). In this case we have uniform weight for all rules but, since the move rule might move to either a safe or unsafe pane, the likelihood of moving to the safe pane is 0.5 and likewise for the unsafe.
We can take this transition system and give it to a (probabilistic model checker) like PRISM. Model checkers allow very rich specification logics (e.g. after a state meeting property X, for all future paths Y holds until Z hold unless A holds), but for our purposes we care mainly about reachability, that is, what is the probability we eventually reach a state where Player 1 is in the end. We specify this using a formula:
P=? [F "psafe(1)"]
Where the F means eventually (that is, somewhere in one of the branches we reach a state where player 1 is safe). We run the same property for all players (incrementing the id as required).
Running this on the simple model we find
| Player | P Safe |
|---|---|
| 1 | 0.125 |
| 2 | 0.500 |
| 3 | 0.875 |
These are exact probabilities: we haven't just run the model multiple times and taken an average. What is great about this is that you can see events that are uncommon (like player 1 getting to the end). While not necessarily essential for this model (if you are player 1 it's not a good place to be!), if you were modelling safety critical systems then you really want to validate in the presence of these "uncommon" events.
These results are as we might expect: player 1 essentially needs to survive three coin tosses while players 2 and 3 have much better chances since they get to learn the safe path created by earlier players.